Corporate reporting is a prime candidate for automation if you can clearly explain the process to produce it, and the process remains consistent over time. Automating your reports has many potential benefits, it can save time, reduce errors, and alleviate the boredom caused by performing repetitive tasks.
The good news is that many tasks can be successfully automated using open source software which is widely available online. There are multiple ways to set up your automated reporting, but they all need the following list of core components in order to function effectively:
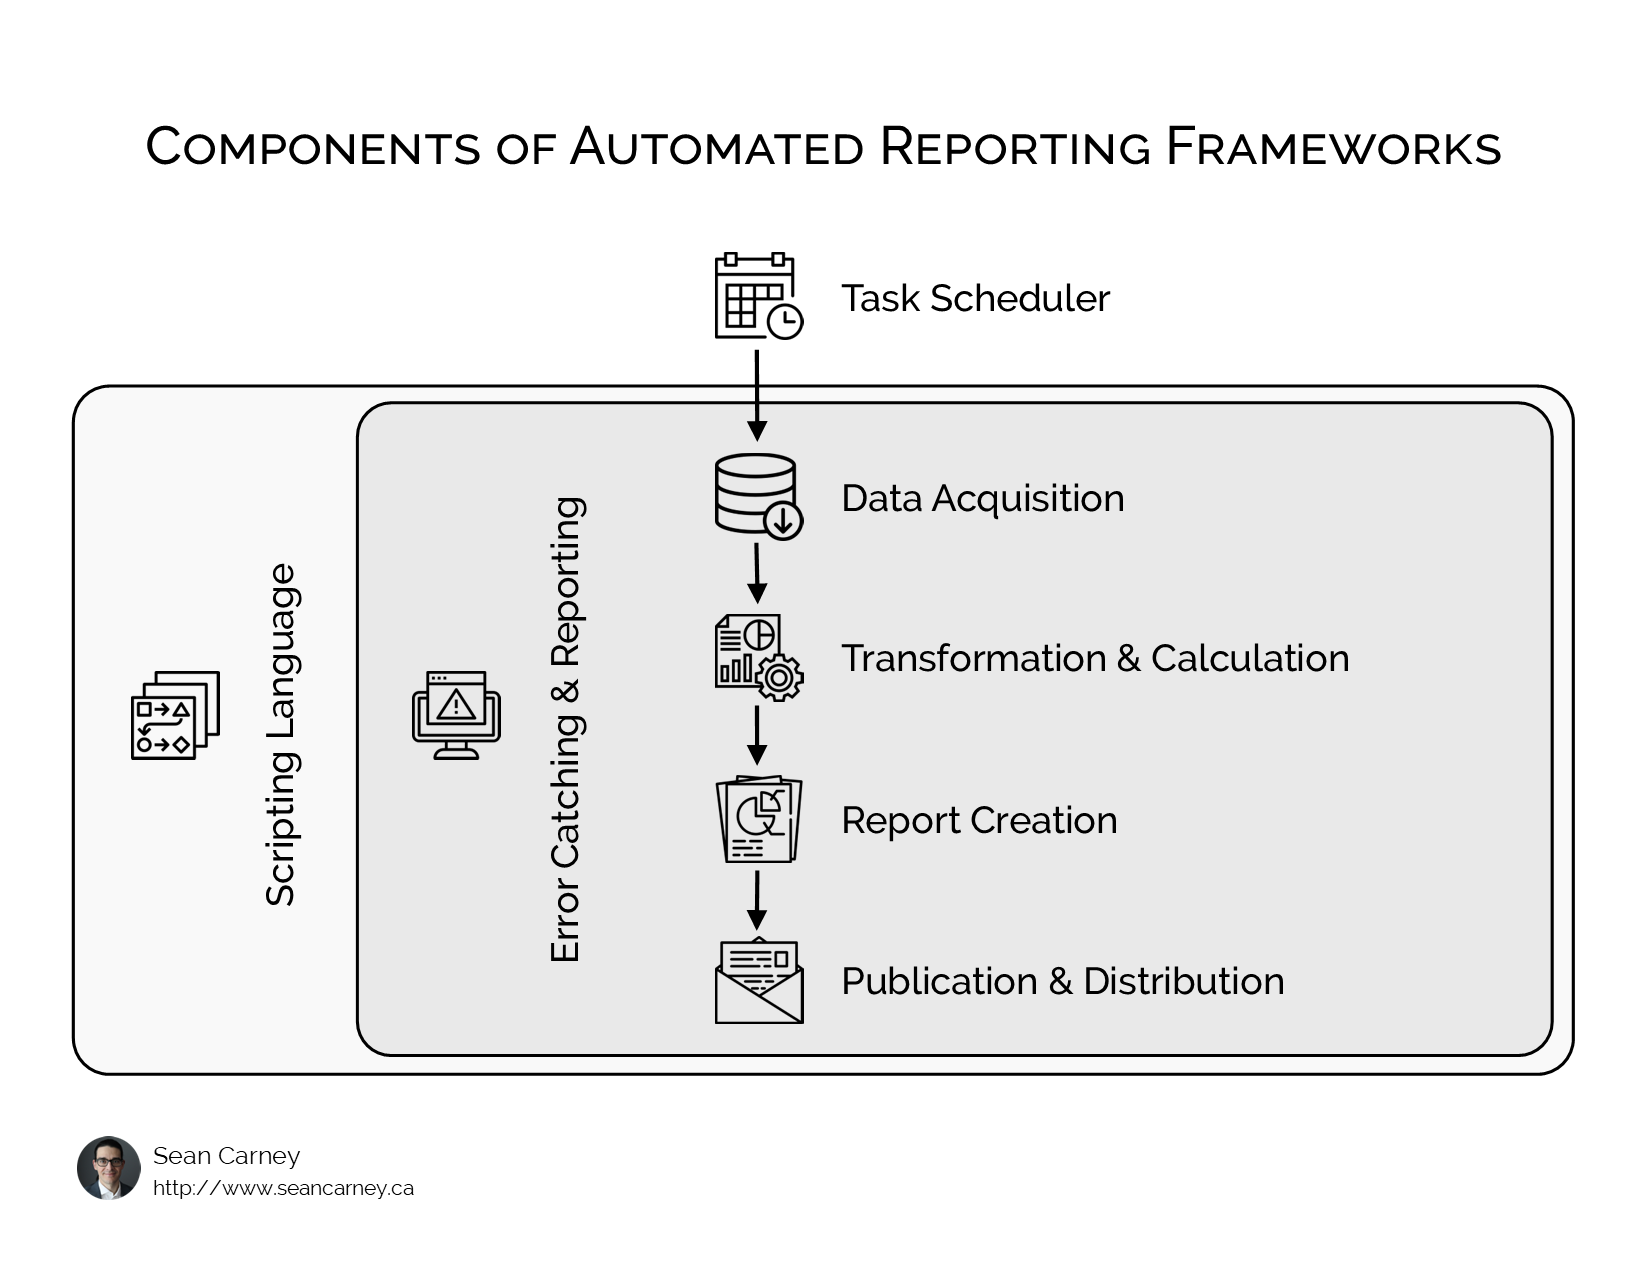
Let’s have a quick look at all these components and examine how they work together. I’ll go into further detail on each of these topics in subsequent blog posts.
Task scheduler
The first part of the process is a piece of software that essentially acts like an alarm clock and sets the time for the report to be updated. The task scheduler needs to be flexible enough to cope with varying schedules (monthly, weekly, bi-weekly, only on certain days of the week, etc).
Scripting language
The scripting language is a programming environment which will actually do the work of getting data, building the report, and sending it out to the various recipients. There are numerous choices in scripting languages each with different strengths and weaknesses, so an important consideration is matching the choice of scripting language to the work that needs to be done.
See my post: Get started with RPA today using free tools for more information about scripting languages.
Error catching & reporting
As hard as we try, it is difficult to create systems that work perfectly 100% of the time. Either invalid data or process changes have the potential to disrupt your automated reports. Consequently, it’s important to add logic to your automated reports to ensure that you are alerted when things go wrong, and that incorrect reports don’t get sent out.
Data acquisition
Now we arrive at the core functions of reporting and our first step is to get some data to report on. This could come from numerous sources: databases, spreadsheets, websites, ERP systems. The most important thing is that the data is available in a consistent format.
Transformation & calculation
The data you get from your sources is rarely in the correct format for reporting. Often you’ll need to combine data from multiple sources, add in calculations, and / or summarize the data for reporting. Luckily most scripting languages can perform these tasks far faster than traditional spreadsheet software (Excel).
Report creation
Once the data is in the correct format, the next step is to actually produce a report using the data. This could take various forms: spreadsheets, dashboards, webpages, or email messages. You might also produce several different reports which are intended for different audiences (managers vs executives).
Publication & distribution
The last step is to save copies of the reports in a central place, or send them directly to the recipients. You will also want to send a message (or a copy of the reports) to yourself to confirm the entire process completed successfully.
That’s all there is to it! There’s no one correct way to do all this, you can choose different tools and approaches based on your situation, but all approaches will share these same core functions and components.
Want to get started automated your reporting or discuss what the options are? Reach out to me using the contact form and I’d be happy to hear from you!